Is this the true life of ETH?
A long time ago, in 2013, Vitalik Buterin proposed the concept of a new cryptocurrency called Ethereum. In 2015, a network based on a single decentralized virtual machine was launched. From that moment, a new era of virtual payments, trading, and other nonsense, such as NFT and games based on it (such as CryptoKitties), began.
At the same time, Ethereum was originally created not so much as a payment system but as a base for the affordable implementation of blockchain technology in third-party projects. This was the ladder to success for the young cryptocurrency, bringing it incredible popularity both among traders and in narrower circles. And to its creator, a fabulous profit.
10 years have passed, ETHUSD is trading around $2,000 per coin, and we are still waiting for a new era to come. It had its ups and downs, but everything is fine now – the coin is alive and kicking, being in second place in terms of popularity and boasting a market cap of over $220 billion.
Moreover, Sui Network was born recently, having an entirely new blockchain architecture. They even say that it is capable of bringing about a technical revolution. Although pretty much every blockchain claims that.
But here comes the news about 1.55 million ETH being withdrawn from the Beacon Chain deposit contract after the activation of Shapella. This is approximately 48,000 validators.
Let's quickly recall what validators are. These are the nodes in the blockchain system that take on the task of keeping the network running. They distribute staking rewards, provide network statistics, control the integrity of blocks, etc. Validators are the main actors in any particular blockchain network. But to maintain performance and complete the tasks, coins are required.
And Shapella is just another hard fork of Ethereum, where it tries to become a reference Proof-of-Stake system.
In general (but not this time), news like this usually has a substantial impact on the price of an asset. Using the economic calendar could be really helpful to keep track of the news flow.
Nevertheless, the rate of change in the number of validators according to the logic declared by the developers, as well as the stability of the consensus since the hard fork, didn't change.
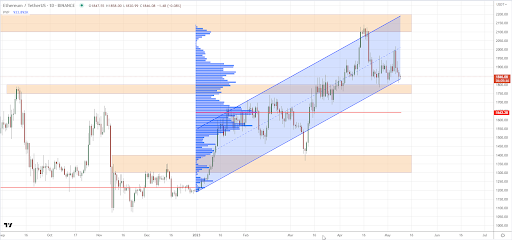
Well, since the price has not changed much against the background of fundamental events, it is worth turning to the technical analysis. You can limit yourself to support and resistance, but do not forget the 200-day moving average.
MA keeps around 1500 and continues to act as support. As you can see, earlier it had already bounced the price by 50%. This was facilitated by the emergence of interest in purchases against the backdrop of the upcoming hard fork, as well as the hard fork itself when it was possible to test the price of $2100.
Regarding levels, the price has tested the mirror level, which is currently the resistance. That's serious. And it is worth paying attention to the fact that it is crucial to break through and consolidate higher for further growth. Buyers have already done a lot to get above $1750-$1800. Thus, they have secured strong support for themselves and use it to their maximum benefit.
The following support can be identified in the range of $1300 to $1400. As mentioned earlier, the 200-day moving average beat the price right there, but this does not negate the fact that the level remains relevant, although one should not put high hopes on it. One, two – well, a maximum of three bounces can be expected, but each time, the probability of such an event decreases. It would be possible to add the Bernoulli formula here – but do you really want to fall into the abyss of mathematical calculations and hypothetical forecasts? Therefore, we simply see the level, understand how many times it has realized itself as a support, and draw the appropriate conclusions.
We can confirm expectations and strengthen the range with the help of Volume Profile. You should remember it since trading activity with increased volumes is often associated with price reversals; such areas are important. Therefore, all attention is on POC.
The 6-month Periodic Volume Profile on the daily chart helps in this case. The main point of control is located around $1650. Smaller deviations in the histogram indicate areas with less horizontal volume accumulation. Still, they are good indicators that we are moving in the right direction as to where and how price might react.
You can complete all of the above by drawing a parallel channel to see that the price still moves upwards. Yes, there are corrections and exits from the channel, so you should not take it at face value. But with complex analysis, this tool can come in handy. It is worth remembering the notorious 2020, when everyone expected the exit from the channel, as another reminder that the market seems to be still alive. But what happened next will never be forgotten. Ah, good times.
In conclusion, it should be said that any analysis can be supplemented with a behavior analysis of the cryptocurrency market leader – Bitcoin. You can better understand the Ethereum ecosystem and its potential for future growth if you keep DeFi in mind. With the right tools and in-depth analysis, investors and industry participants can use this insight to make informed decisions about investing in Ethereum.
Ethereum's analysis can provide valuable data on transaction records, volumes, price trends, and much more. This can be informative in terms of investment strategies, identifying market anomalies, and evaluating the overall health of the Ethereum network. In addition, organizations can use analytics to better understand the technology behind Ethereum and its implications for businesses and individuals.


Post a Comment